weights#
- regridding.weights(coordinates_input, coordinates_output, axis_input=None, axis_output=None, weights_input=None, method='multilinear', perturb=None)[source]#
Save the results of a regridding operation as a sequence of weights, which can be used in subsequent regridding operations on the same grid.
The results of this function are designed to be used by
regridding.regrid_from_weights()This function returns a tuple containing a ragged array of weights, the shape of the input coordinates, and the shape of the output coordinates.
- Parameters:
coordinates_input (tuple[ndarray, ...]) – Coordinates of the input grid.
coordinates_output (tuple[ndarray, ...]) – Coordinates of the output grid. Should have the same number of coordinates as the input grid.
axis_input (None | int | Sequence[int]) – Logical axes of the input grid to resample. If
None, resample all the axes of the input grid. The number of axes should be equal to the number of coordinates in the input grid.axis_output (None | int | Sequence[int]) – Logical axes of the output grid corresponding to the resampled axes of the input grid. If
None, all the axes of the output grid correspond to resampled axes in the input grid. The number of axes should be equal to the number of coordinates in the output grid.weights_input (None | ndarray) – Weights applied to the values of the input grid before resampling.
method (Literal['multilinear', 'conservative']) – The type of regridding to use.
perturb (None | bool) – Whether to perturb coordinates_output by a small value to avoid degenerate grids. This is helpful for some methods, like
conservative, which sometimes cannot handle degenerate grids. IfNone(the default), no perturbation is applied unless method isconservativeand the dimensions of the grid are 2D or higher. IfTrue, each point is perturbed using a normal distribution with standard deviation equal to1e-9of the grid width.
- Return type:
Examples
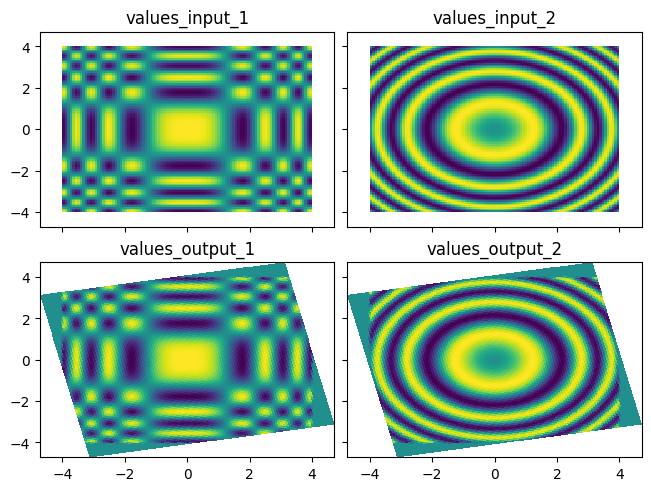
Regrid two arrays of values defined on the same grid using saved weights.
import numpy as np
import scipy.signal
import matplotlib.pyplot as plt
import regridding

# Define input grid
x_input = np.linspace(-4, 4, num=101)
y_input = np.linspace(-4, 4, num=101)
x_input, y_input = np.meshgrid(x_input, y_input, indexing="ij")

# Define rotated output grid
angle = 0.2
x_output = x_input * np.cos(angle) - y_input * np.sin(angle)
y_output = x_input * np.sin(angle) + y_input * np.cos(angle)

# Define two arrays of values defined on the same grid
values_input_1 = np.cos(np.square(x_input)) * np.cos(np.square(y_input))
values_input_2 = np.sin(np.square(x_input) + np.square(y_input))

# Convolve with a 2x2 uniform kernel to simulate values defined on cell centers
values_input_1 = scipy.signal.convolve(values_input_1, np.ones((2, 2)), mode="valid")
values_input_2 = scipy.signal.convolve(values_input_2, np.ones((2, 2)), mode="valid")

# Save regridding weights relating the input and output grids
weights = regridding.weights(
    coordinates_input=(x_input, y_input),
    coordinates_output=(x_output, y_output),
    method="conservative",
)

# Regrid the first array of values using the saved weights
values_output_1 = regridding.regrid_from_weights(
    *weights,
    values_input=values_input_1,
)

# Regrid the second array of values using the saved weights
values_output_2 = regridding.regrid_from_weights(
    *weights,
    values_input=values_input_2,
)

# Plot the original and regridded arrays of values
fig, axs = plt.subplots(
    nrows=2,
    ncols=2,
    sharex=True,
    sharey=True,
    constrained_layout=True,
)
axs[0, 0].pcolormesh(x_input, y_input, values_input_1);
axs[0, 0].set_title(r"values_input_1");
axs[0, 1].pcolormesh(x_input, y_input, values_input_2);
axs[0, 1].set_title(r"values_input_2");
axs[1, 0].pcolormesh(x_output, y_output, values_output_1);
axs[1, 0].set_title(r"values_output_1");
axs[1, 1].pcolormesh(x_output, y_output, values_output_2);
axs[1, 1].set_title(r"values_output_2");